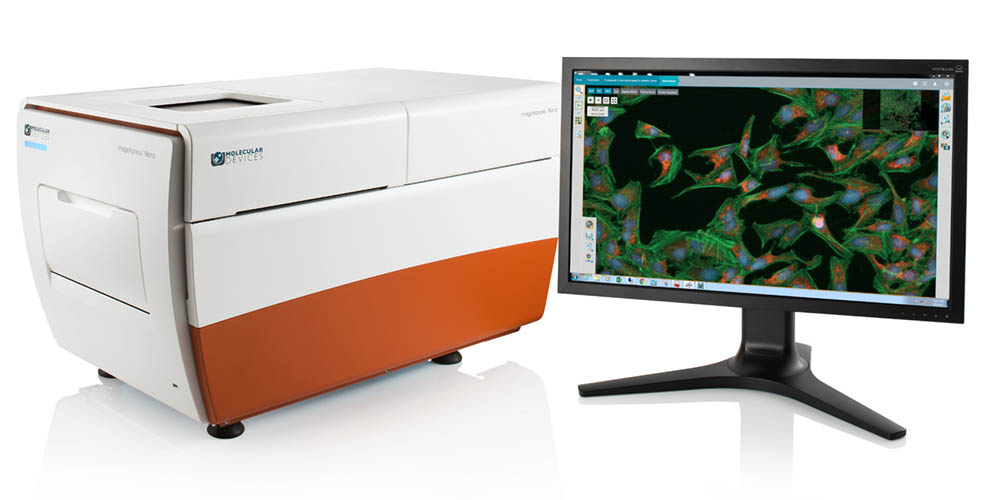
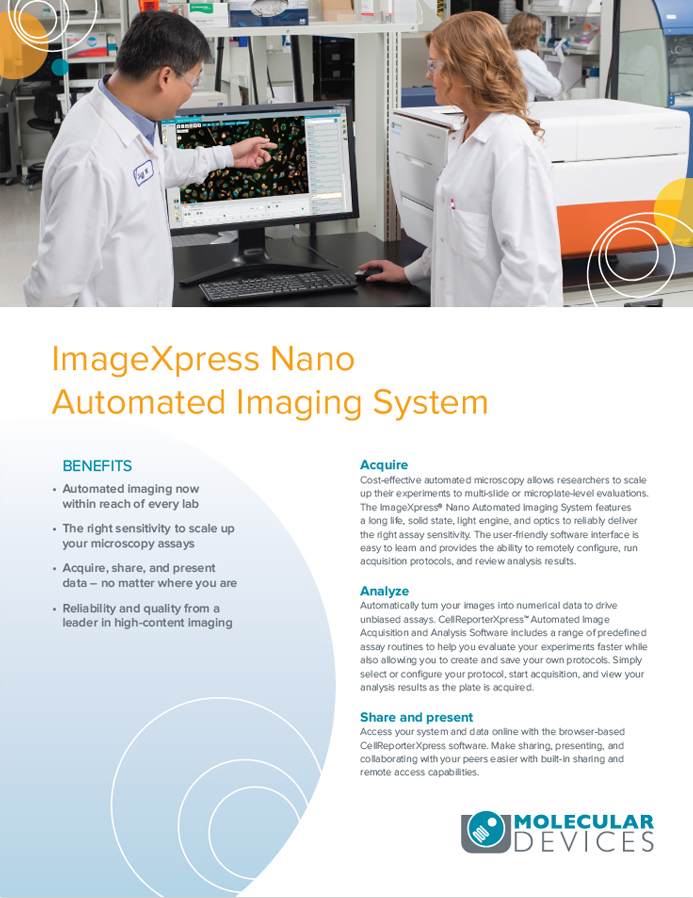
自動化された細胞画像取得・解析システムで、より簡単に、より自由な研究を行えます。
ImageXpress Nanoは、ユーザーフレンドリーな新しい解析ソフトウェアを搭載したイメージング・セルレポータ―です。ブラウザベースのソフトウェアにより、Windows、Mac、iPadなどの様々なデバイスから柔軟なデータアクセスを実現しました。データライブラリやプリセットプロトコールを有しており、画像の取得から解析までを自動かつ簡単に操作できます。- Overview
- Specifications
- Resource
特徴
- サンプルの画像取得からグラフ出力までが5クリックの簡単操作
- ブラウザベースでユーザーフレンドリーなイメージングソフトウェア
- データへの柔軟なアクセス・簡易なデータマネジメントを実現
- 解析は対象となる画像をクリックするだけのシンプルオペレーション
|
Angiogenesis
|
Apoptosis
|
Autophagy
|
Cell Count
|
Cell Count – Transmitted Light
|
|
Cell Differentiation
|
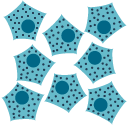
Cell Scoring
|
Cell Scoring – Transmitted Light
|
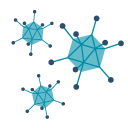
Endocytosis
|
Internalization
|
|
Live Cells
|
Lysosomes
|
Mitochondria
|
Mitotic Index
|
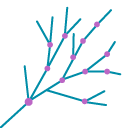
Neurite Tracing
|
|
Phagocytosis
|
Pits and Vesicles or Endosomes
|
Protein Expression Index
|
Viral Infectivity
|


CellReporterXpress
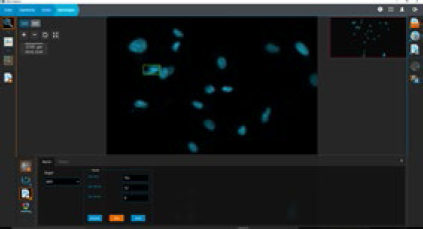
最新機種ImageXpress Nanoに新しく搭載された画像取得・解析ソフトウェアCellReporterXpressは、機械学習機能を採用しているため、画像の取得からデータ解析までを、最小限の設定で行えます。
シンプルな操作性で、よりスムーズでスピーディな画像解析を可能にします。
CellReporterXpressによる解析プロセス
5クリック画像解析
優れたセグメント機能により、画像1枚につきほぼ1クリックで解析対象を設定していただけます。
解析後のデータ確認までを5クリックで行うことができ、ウェルごとのデータの代表値から個々の細胞の測定値まで対象を絞ることも可能です。
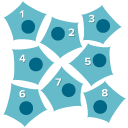
解析ツール”Cell Scoring”を用いた、蛍光染色された個々の培養細胞の輝度、面積、個数の解析事例
解析前
① 計測したい細胞核をクリックすることで、ソフトウェアが自動的に細胞核を定義するパラメーターを設定

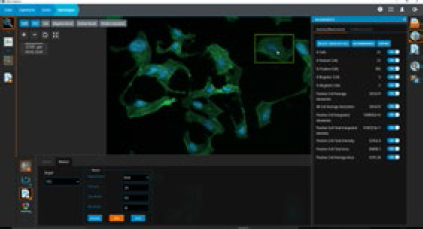
② 同様に細胞体をクリックし、細胞体を定義するパラメーターを設定
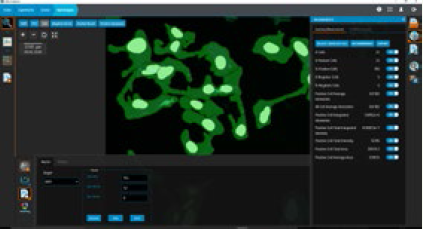
③ 密接した細胞も高精度にセグメントが行われ、解析が実行されます

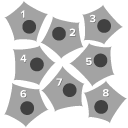
解析後
④ 解析結果は様々な形式でレポート可能です
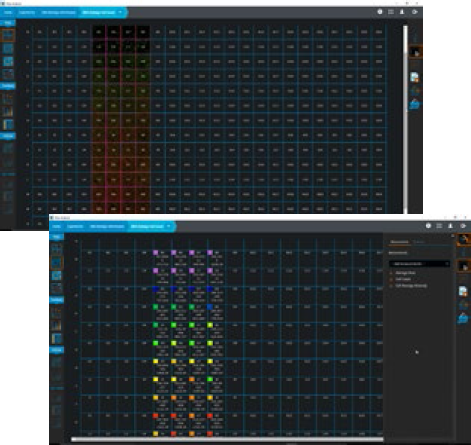
任意の計測結果をウェル形式でヒートマップ表示
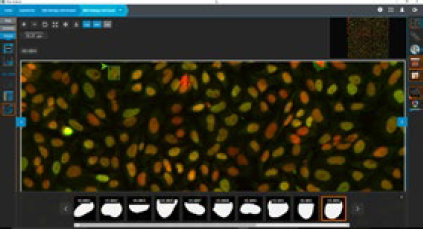
⑤ 解析結果から個々の細胞画像を一覧表示できるなど、すべての数値データと画像データはデータリンク化されています
⑥ 解析後のグラフ表示
ImageXpress Nanoチュートリアルビデオの閲覧
【1】Set Up Aquisition
【2】Setting Up Focus
【3】Analysis Protocal
【4】Access Your Images
| Stages | ||
|---|---|---|
| Linear encoded voice coil driven X, Y, and Z stages have < 100 nm resolution |
| Objectives | ||
|---|---|---|
| Variety of Nikon 2x- 60x lenses are supported. |
| Filter Options | ||||
|---|---|---|---|---|
| Fluorophore | Part Number | Ex (nm) | Dichroic (nm) | EM (nm) |
| DAPI, Alexa Fluor 350, AMCA, BFP, Hoechst, LysoSensor Blue, Marina Blue, Pacific Blue, and sgBFP |
1-6300-0442
|
377/50
|
327-404 (R)
415-950 (T)
|
447/60
|
| CFP, AmCyan, SYTOX Blue, BOBO-1, BO-PRO-1 |
1-6300-0447
|
438/24
|
426-450 (R)
467-950 (T)
|
483/32
|
| GFP, Cy2™, CyQuant, DiO, EGFP, sgGFP™, wtGFP (non-UV excitation), YOYO-1, YO-PRO-1 |
1-6300-0450
|
472/30
|
350-488 (R)
502-950 (T)
|
520/35
|
| FITC, FAM, Alexa Fluor 488, BODIPY, Calcein, Fluo-4, MitoTracker Green, Oregon Green, Rhodamine 110, rsGFP (red-shifted GFP, S65T) |
1-6300-0443
|
482/35
|
350-500 (R)
513-950 (T)
|
536/40
|
|
YFP, Calcium Green-1, Eosin, Fluo-3, Rhodamine 123
|
1-6300-0448
|
500/24
|
350-512 (R)
528-950 (T)
|
542/27
|
| TRITC, Alexa Fluor 546, 5-TAMRA, Alexa Fluor 532, SpectrumOrange™, BODIPY TMR, DiI, POPO-3, PO-PRO-3, Rhodamine |
1-6300-0444
|
543/22
|
350-555 (R)
569-950 (T)
|
593/40
|
| Cy3™, DsRed, Alexa Fluor 555, Calcium Orange, LysoTracker Yellow, MitoTracker Orange, Phycoerythrin (PE), Rhodamine Phallicidine, and TAMRA |
1-6300-0445
|
531/40
|
350-555 (R)
569-950 (T)
|
593/40
|
| Texas Red®, mCherry, 5-ROX, Alexa Fluor 568 & 594, Calcium Crimson, Cy3.5™, HcRed, Propidium Iodide, and MitoTracker Red |
1-6300-0449
|
562/40
|
350-585 (R)
601-950 (T)
|
624/40
|
| Cy5™, SpectrumFRed™, Alexa Fluor 647 & 660, APC (Allophycocyanin), BODIPY 650/665, DiD, SYTO Red, DRAQ5, TOTO-3, and TO-PRO-3 |
1-6300-0446
|
628/40
|
350-651 (R)
669-950(T)
|
692/40
|
Filter specifications are current as of June 15, 2017.
| Space and Weight Specifications | ||||||||
|---|---|---|---|---|---|---|---|---|
|
ImageXpress Nano system configuration
|
W (in.)
|
D (in.)
|
H (in.)
|
Weight (lbs)
|
W (cm)
|
D (cm)
|
H (cm)
|
Weight (kg)
|
|
ImageXpress Nano Base Unit System
|
21
|
34
|
19
|
215
|
53
|
86
|
48
|
95
|
|
Transmitted Light and Live Cell (Environmental Control)
|
21
|
34
|
32
|
220
|
53
|
86
|
81
|
100
|
|
Transmitted Light
|
21
|
34
|
32
|
220
|
53
|
86
|
81
|
100
|
|
Live Cell (Environmental Control)
|
21
|
34
|
19
|
210
|
53
|
86
|
48
|
95
|
ImageXpress Nano パンフレットのダウンロード
イメージング総合カタログ
ImageXpress シリーズ 製品カタログのダウンロード
アプリケーションノートのダウンロード
 Phenotypic characterization of anti-cancer drug effects using automated imaging
Discovery and evaluation of anti-cancer therapies is an active area of research that includes development of cell-based models, screening for novel drugs, comparison of drug efficacy,…
オートファジーは、細胞ストレスを受けて損傷したタンパク質やオルガネラを分解・再生する高度に管理されたプロセスです。このアプリケーションノートでは自動イメージングシステムImageXpress® Nanoを用いたオートファジーに対する化合物の影響を調べるスクリーニングアッセイの効率を評価しました。
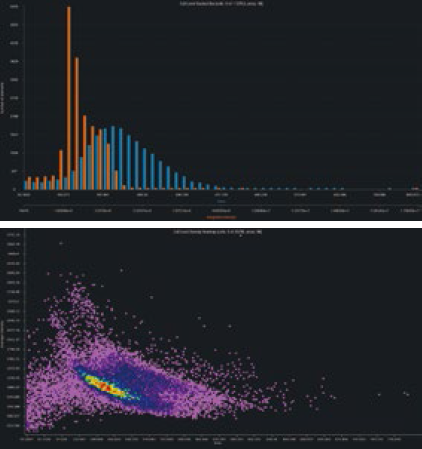
多くの生物学のアプリケーションでは、蛍光マーカーやその他の標識をせずに、時間経過に沿った複数の時点での細胞数や細胞の健康状態、培養密度および細胞増殖をモニタリングすることが求められます。特に、透過光(TL)イメージングを用いて細胞をモニタリングする際は、多様な細胞応答を評価するために信頼性が高く効率的な細胞計数方法が必要とされています。このアプリケーションノートでは、ラベルフリーの細胞の透過光画像を用いた細胞計数と、核を蛍光標識した画像による細胞計数の比較により、ラベ ルフリーの細胞の計数精度を評価しました。さらに、HeLa細胞を4種類の細胞毒性化合物により処理し、透過光画像を用いた細胞計数により、毒性評価を行いました。
ポスターのダウンロード