細胞イメージングを可能にするSpectraMax i3/i3xマルチモード検出プラットフォーム専用のアップグレードオプションで細胞の生存率を測定できます。
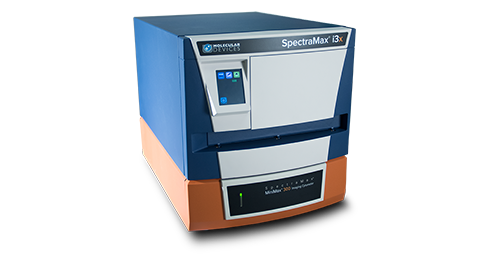
SpectraMax® i3/i3xマルチモード検出プラットフォームで、もっと見て、もっと研究してください。ラボサイトでのアップグレードが可能なSpectraMax® MiniMax™ 300イメージングサイトメーターにより、細胞の迅速なイメージングと解析が可能となり、細胞毒性、細胞増殖およびタンパク質発現に伴って生じる表現型の変化について、観察ができます。さらなる解析のため、明視野画像解析機能のStainFree™テクノロジーと緑色および赤色蛍光検出チャンネルを備えています。
SpectraMax MiniMax 300イメージングサイトメーターの特長
-

簡素化されたワークフロー
小さな設置面積で細胞イメージングアッセイを追加できます。
-

染色不要の解析
StainFree™テクノロジーによって、細胞カウントおよびコンフルエンシー測定のための細胞染色をなくします。
-

より大量のデータ
明視野と緑色および赤色蛍光イメージングにより、マルチパラメトリックな細胞ベースアッセイが可能です。
-
使い慣れたソフトウェア
SoftMax®Proマイクロプレートデータ取得・解析ソフトウェアを使用して、セットアップも画像取得・解析も簡単に行えます。
-
高感度
細胞密度の低いサンプルも容易に測定できます。
-
データの補正
プレートリーダーの試験データを各ウェルの細胞数で正規化します。
-
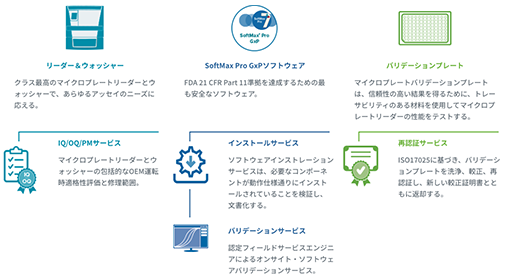
実績あるGxPソリューションでデータインテグリティとコンプライアンスを保証
GMP/GLP規制環境下施設のための当社の包括的な一連の実績あるコンプライアンスソリューションは、みなさまの取り組みを促進し、迅速に自信を持って、規制に準拠した施設を確立します。
- ・最高クラスのマイクロプレートリーダーおよび ウォッシャーですべてのアッセイニーズをサポート
IQ/OQ/PMサービスにより、規制を遵守したデジタルフォーマットで機器の文書を保存 - ・ソフトウェアインストールサービスで、操作仕様のために必要な要素がインストールされていることを確認し記録
- ・ソフトウェアバリデーションサービスはFDA 21 CFR Part 11ガイドラインをサポート
- ・IT担当者の負担を軽減するWindows Active Directoryとの連携やバリデーションプレートなどのトレーサブルな材料を用いて、信頼性のある結果を得るために必要なマイクロプレートリーダーの性能を試験
- ・最高クラスのマイクロプレートリーダーおよび ウォッシャーですべてのアッセイニーズをサポート
-
「SpectraDrop 微量サンプル測定プレート」でより少量のDNA、RNA、タンパク質をより迅速に定量
卓上型マイクロプレートリーダーのためのマイクロボリュームソリューション SpectraDrop™微量サンプル測定プレートは少量測定のためのハイスループットソリューションを実現します。革新的なデザインにより、サンプル調製時間を短縮し、2 µLという少量のDNA、RNA、タンパク質サンプルに対するラボの生産性を高めることができ、吸光、蛍光測定モードに対応します。マイクロプレートのフォーマットは均一で再現性のある分析を保証し、Molecular Devices 製StakMax®マイクロプレートスタッカーとシームレスに統合することで研究能力を向上させることができます。
詳しくはこちら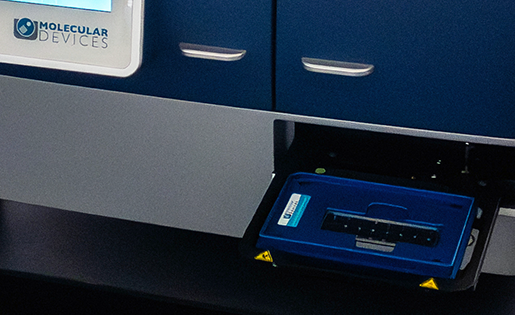
対応アプリケーション
-
細胞数/信頼性
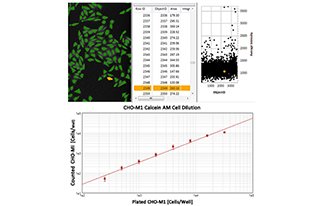
・CHO細胞を96ウェルプレートに32000細胞/ウェルから2倍希釈でプレーティング ・細胞をカルセインAM色素で染色し計数
-
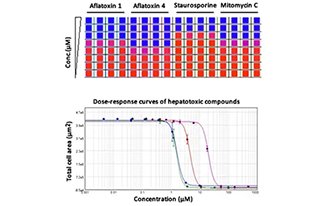
細胞増殖/細胞毒性
・肝細胞を肝毒性を引き起こす既知の化合物で処理 ・細胞総面積の測定により増殖/毒性効果を評価
-
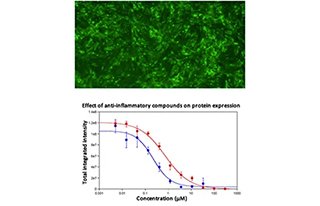
マーカーの発現
・HUVEC細胞を抗炎症性化合物で前処理し、炎症性サイトカイン存在下で培養 ・刺激されたタンパク質発現は、総積算強度により測定
その他のアプリケーション
- 無染色セルカウント
- 細胞生存率と細胞毒性
- ミトコンドリア毒性
- アポトーシス
SpectraMax MiniMax 300 イメージングサイトメーターの仕様
| 光源 | 独自の固体照明、白色、460/20 nmおよび625/20 nm励起 | |
|---|---|---|
| 検出器 | 1.25メガピクセル、12ビット高感度CCDカメラ | |
| 発光 | 明視野; 緑 541/108 nm; 赤 713/123 nm | |
| 対物レンズ | シングル4倍対物レンズ | |
| オートフォーカス | 独自のレーザースキャニングオートフォーカス | |
| 解像度 | 1.9 μm x 1.9 μm ピクセルサイズ | |
| データ取得・解析ソフトウェア | SoftMax® Pro Software MiniMax Imaging Edition | |
| イメージング速度* | データ取得 | データ取得 + 解析 |
| 1カラー - 96ウェル | 3:40 | 6:30 |
| 2カラー - 96ウェル | 3:40 | 6:30 |
| 検体キャリア | ANSI/SBS準拠マイクロプレート 96および384ウェル |
|
| 寸法(cm) | 39.2 cm W x 19.5 cm H x 60.6 cm D(SpectraMax® MiniMax™ 300イメージングサイトメーター) 39.2 W x 44.0 H x 60.6 L (ベースシステム使用時) |
|
* 露光時間10msのシングルサイト撮影を使用。
詳細を見る
-
試薬・消耗品・アクセサリー
該当の試薬・消耗品はありません。
-
保守サービス・サポート